SAVINGS OPPORTUNITY SCAN
Your spend is hiding savings.
SpendCraft finds them.
Run a scan on your classified spend. SpendCraft surfaces savings signals across four opportunity types: quantified, ranked by impact, and ready to act on. No consulting project. No waiting.
Every savings figure traces to your normalized transactions.
One scan. Four signals. Every figure traceable.
SpendCraft scans your normalized, classified spend and surfaces opportunities across four signal types. Each one is quantified with a savings range and tied to the transactions that produced it.
WHAT A COMPLETED SCAN LOOKS LIKE
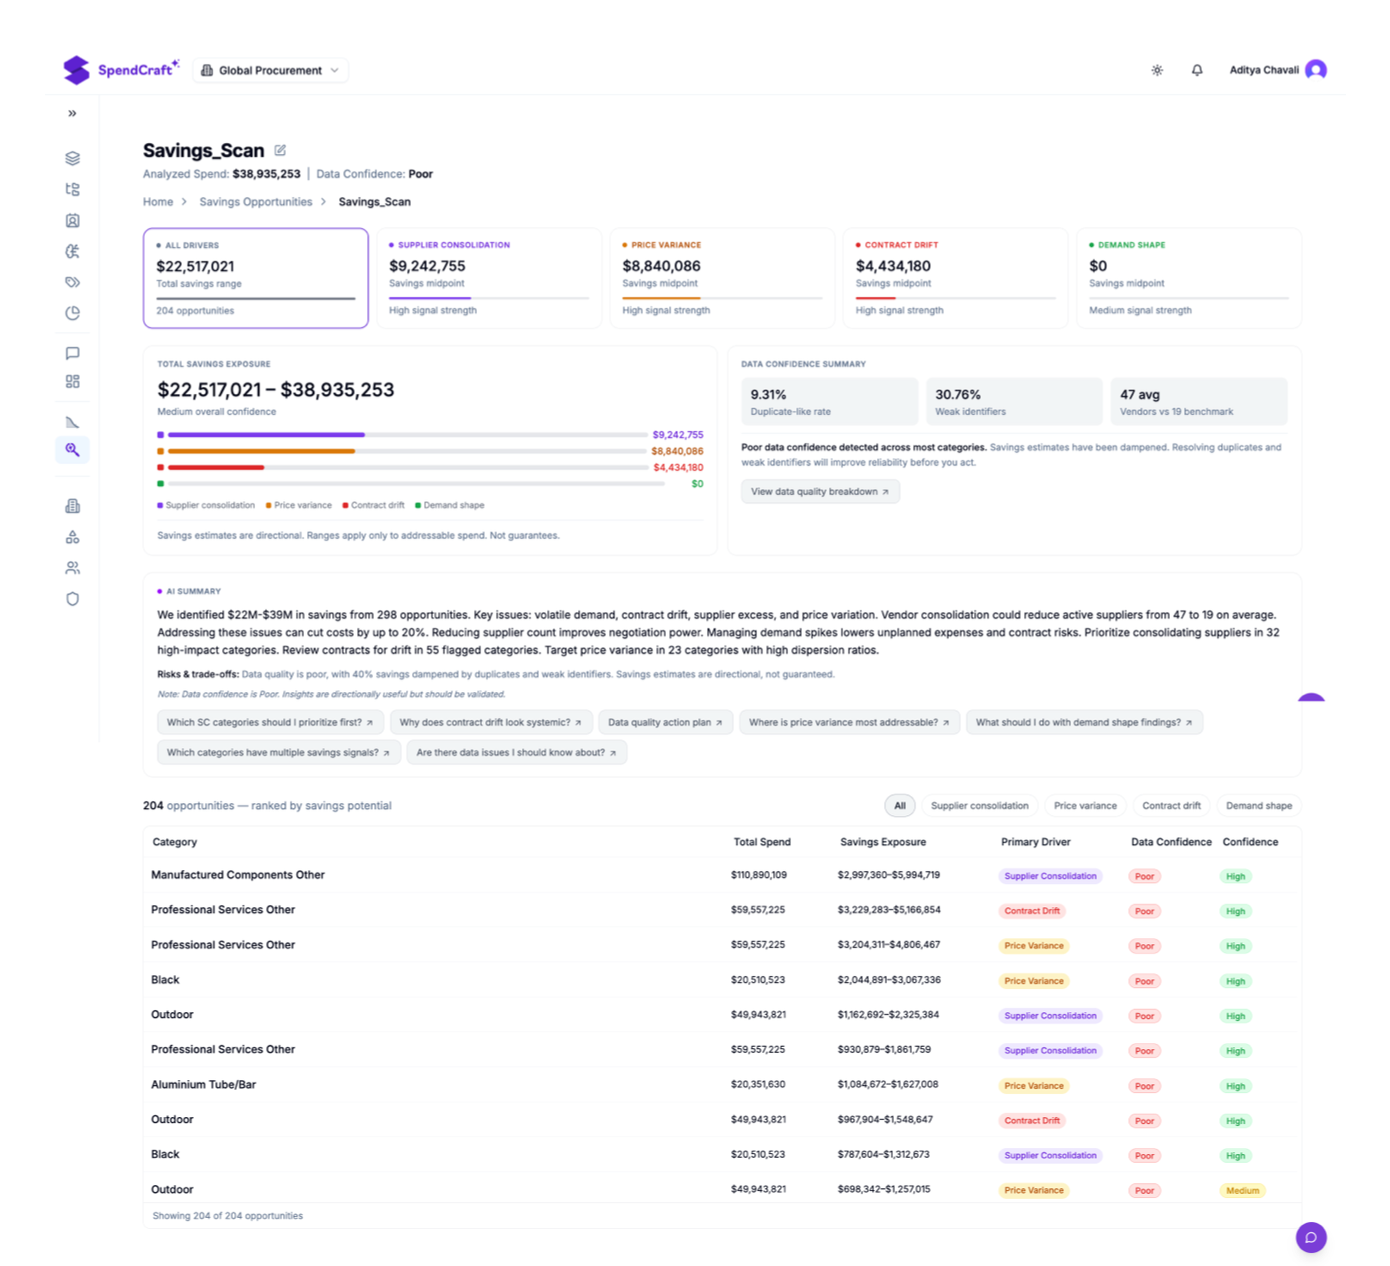
This is what SpendCraft returns after a single scan, not a consultant's slide deck. Your data. Your numbers. Ready in hours.
Four things SpendCraft looks for in every scan.
SUPPLIER CONSOLIDATION
Too many suppliers competing for the same category spend. SpendCraft identifies where volume is fragmented and consolidation would increase leverage.
PRICE VARIANCE
The same item or service invoiced at different prices across the business. SpendCraft surfaces the gap between what you're paying and what you could be paying.
CONTRACT DRIFT
Spend flowing to suppliers outside contracted terms. SpendCraft flags where purchasing behavior has diverged from your category strategy.
PURCHASING PATTERNS
How you buy creates cost, not just what you buy. SpendCraft identifies transaction patterns such as order frequency, batch size, and timing that add unnecessary spend.
Every signal produces a ranked opportunity with a min to max savings range, a confidence indicator, and a recommended next action. 208 signals in a single scan. All grounded in your data.
WHAT EACH OPPORTUNITY LOOKS LIKE
One category. Two overlapping signals.
Savings range calculated from your actual transactions.
Every opportunity in a SpendCraft scan includes a savings exposure range, the transaction evidence behind it, a signal strength indicator, and a recommended next action. Where multiple signals overlap in the same category, both are surfaced so nothing is missed.
$2,990,090 to $5,980,180
Savings exposure for Manufactured Components Other
357
Active vendors vs 142 benchmark
“This category has 357 active vendors, 2.5 times the benchmark of 142, causing fragmented spend. The top three suppliers cover only 24.7% of spend, leaving 75.3% dispersed among many vendors.”
Also flagged: Contract Drift $61,572 to $123,145
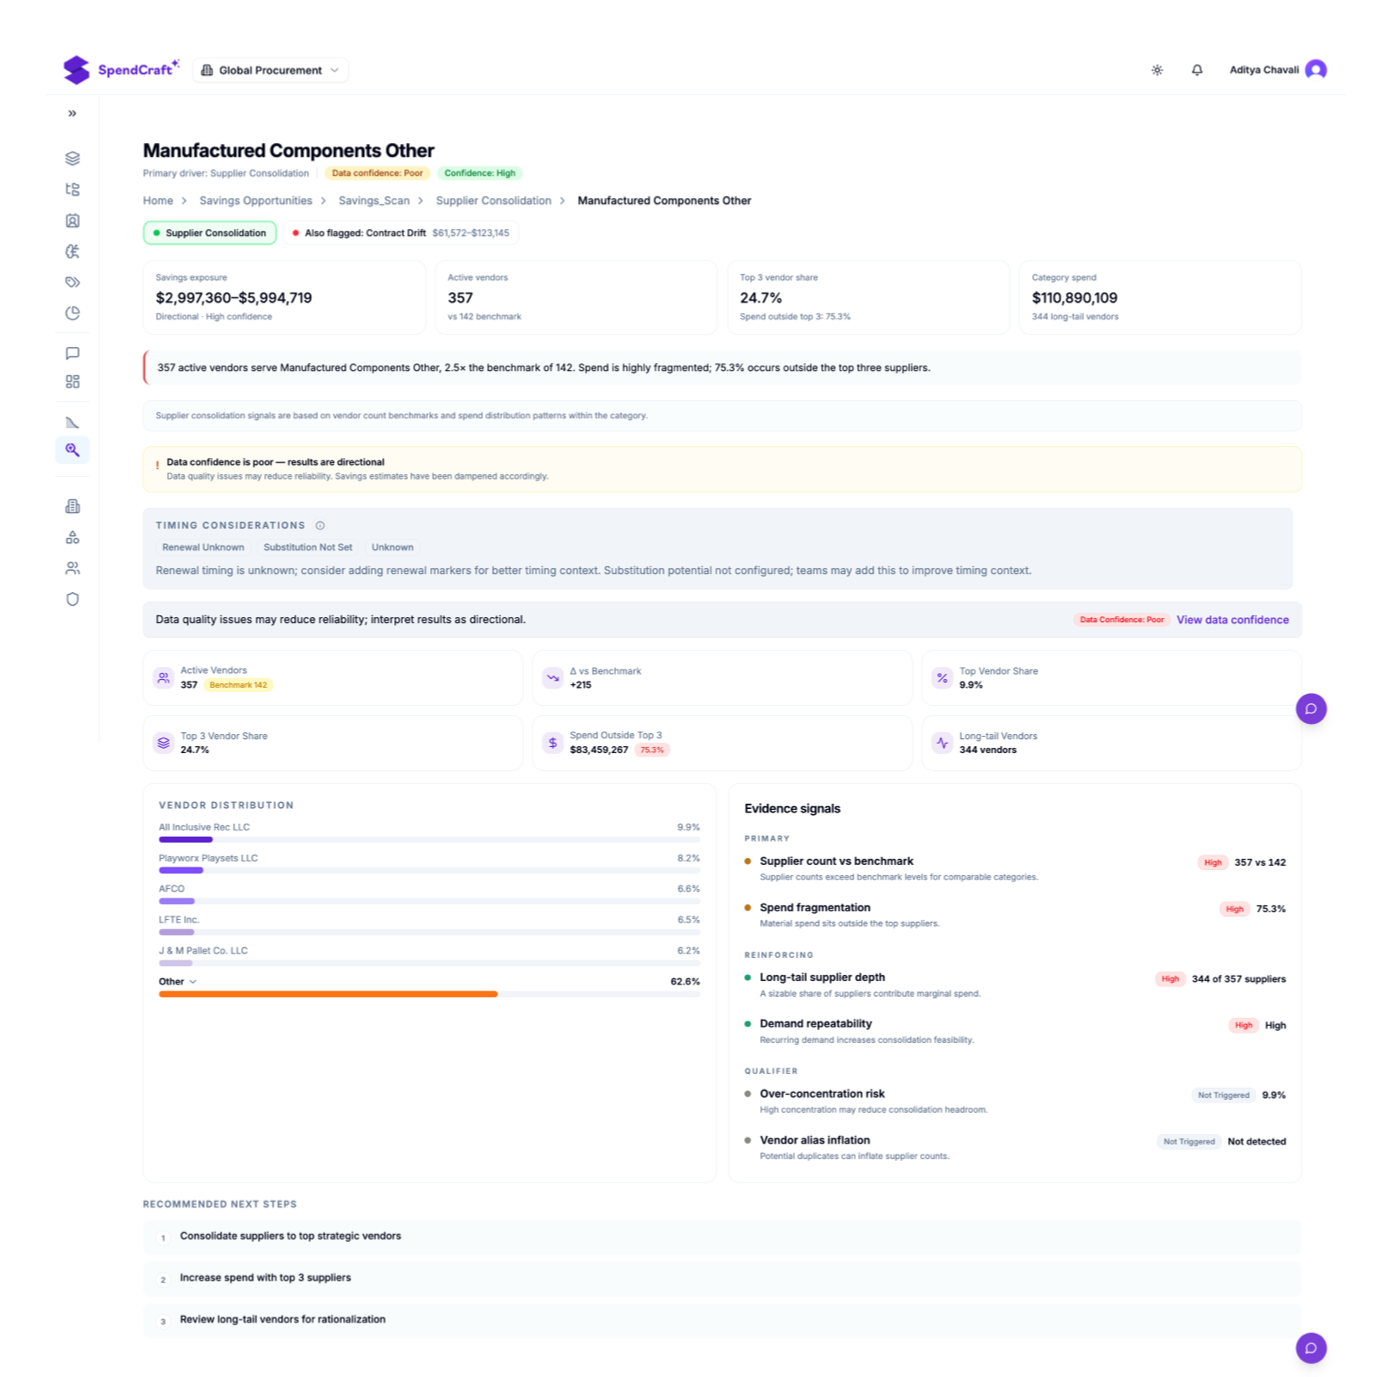
One category. Two overlapping signals. Savings range calculated from your actual transactions, not benchmarks or estimates.
The numbers are yours. The math is ours.
Every savings figure in a SpendCraft scan is calculated directly from your normalized transaction data. It is not modelled and not benchmarked against external databases. Min to max ranges, signal strength indicators, and data confidence scores are shown on every opportunity so your team acts on evidence, not hypotheses.
Hours
Time from scan launch to ranked opportunity list
4
Signal types scanned simultaneously
$0
Cost to run a scan on every plan
Every savings figure traces to your actual normalized transactions. Deterministic math. Fully inspectable.
GET STARTED
The savings are already in your data.
SpendCraft finds them in hours.
Connect your spend data, run a classification, and launch a Savings Opportunity Scan. SpendCraft surfaces the signals ranked by impact, quantified from your transactions, ready to act on. No consulting project. No waiting.
Self-service pricing from $899/month. No implementation cost. Enterprise pricing available.
Get value fast. Start small. Scale when it's proven.
Enabling Business Users.