REPORTING & ANALYTICS
Dashboards that already
know your spend.
Every report, chart, and dashboard in SpendCraft runs on your classified, normalized spend the moment classification completes. No dashboard builder. No BI project. No waiting on a data team. Pre-built analytics that work because the foundation is already in place.
Dashboards grounded in classified spend, ready the moment classification completes.
Pre-built. Grounded. Ready.
SpendCraft's reports aren't templates you configure. They are analytics that work the moment your data is classified. Category concentration, vendor share, trend lines, budget variance, and multi-dataset comparisons. All driven by the same structured foundation that powers the scans and the chat.
WHAT REPORTING & ANALYTICS LOOKS LIKE
Not a dashboard you built. A dashboard that already knows your spend. Change the period, switch the dataset, compare against last year: the data is already classified to answer.
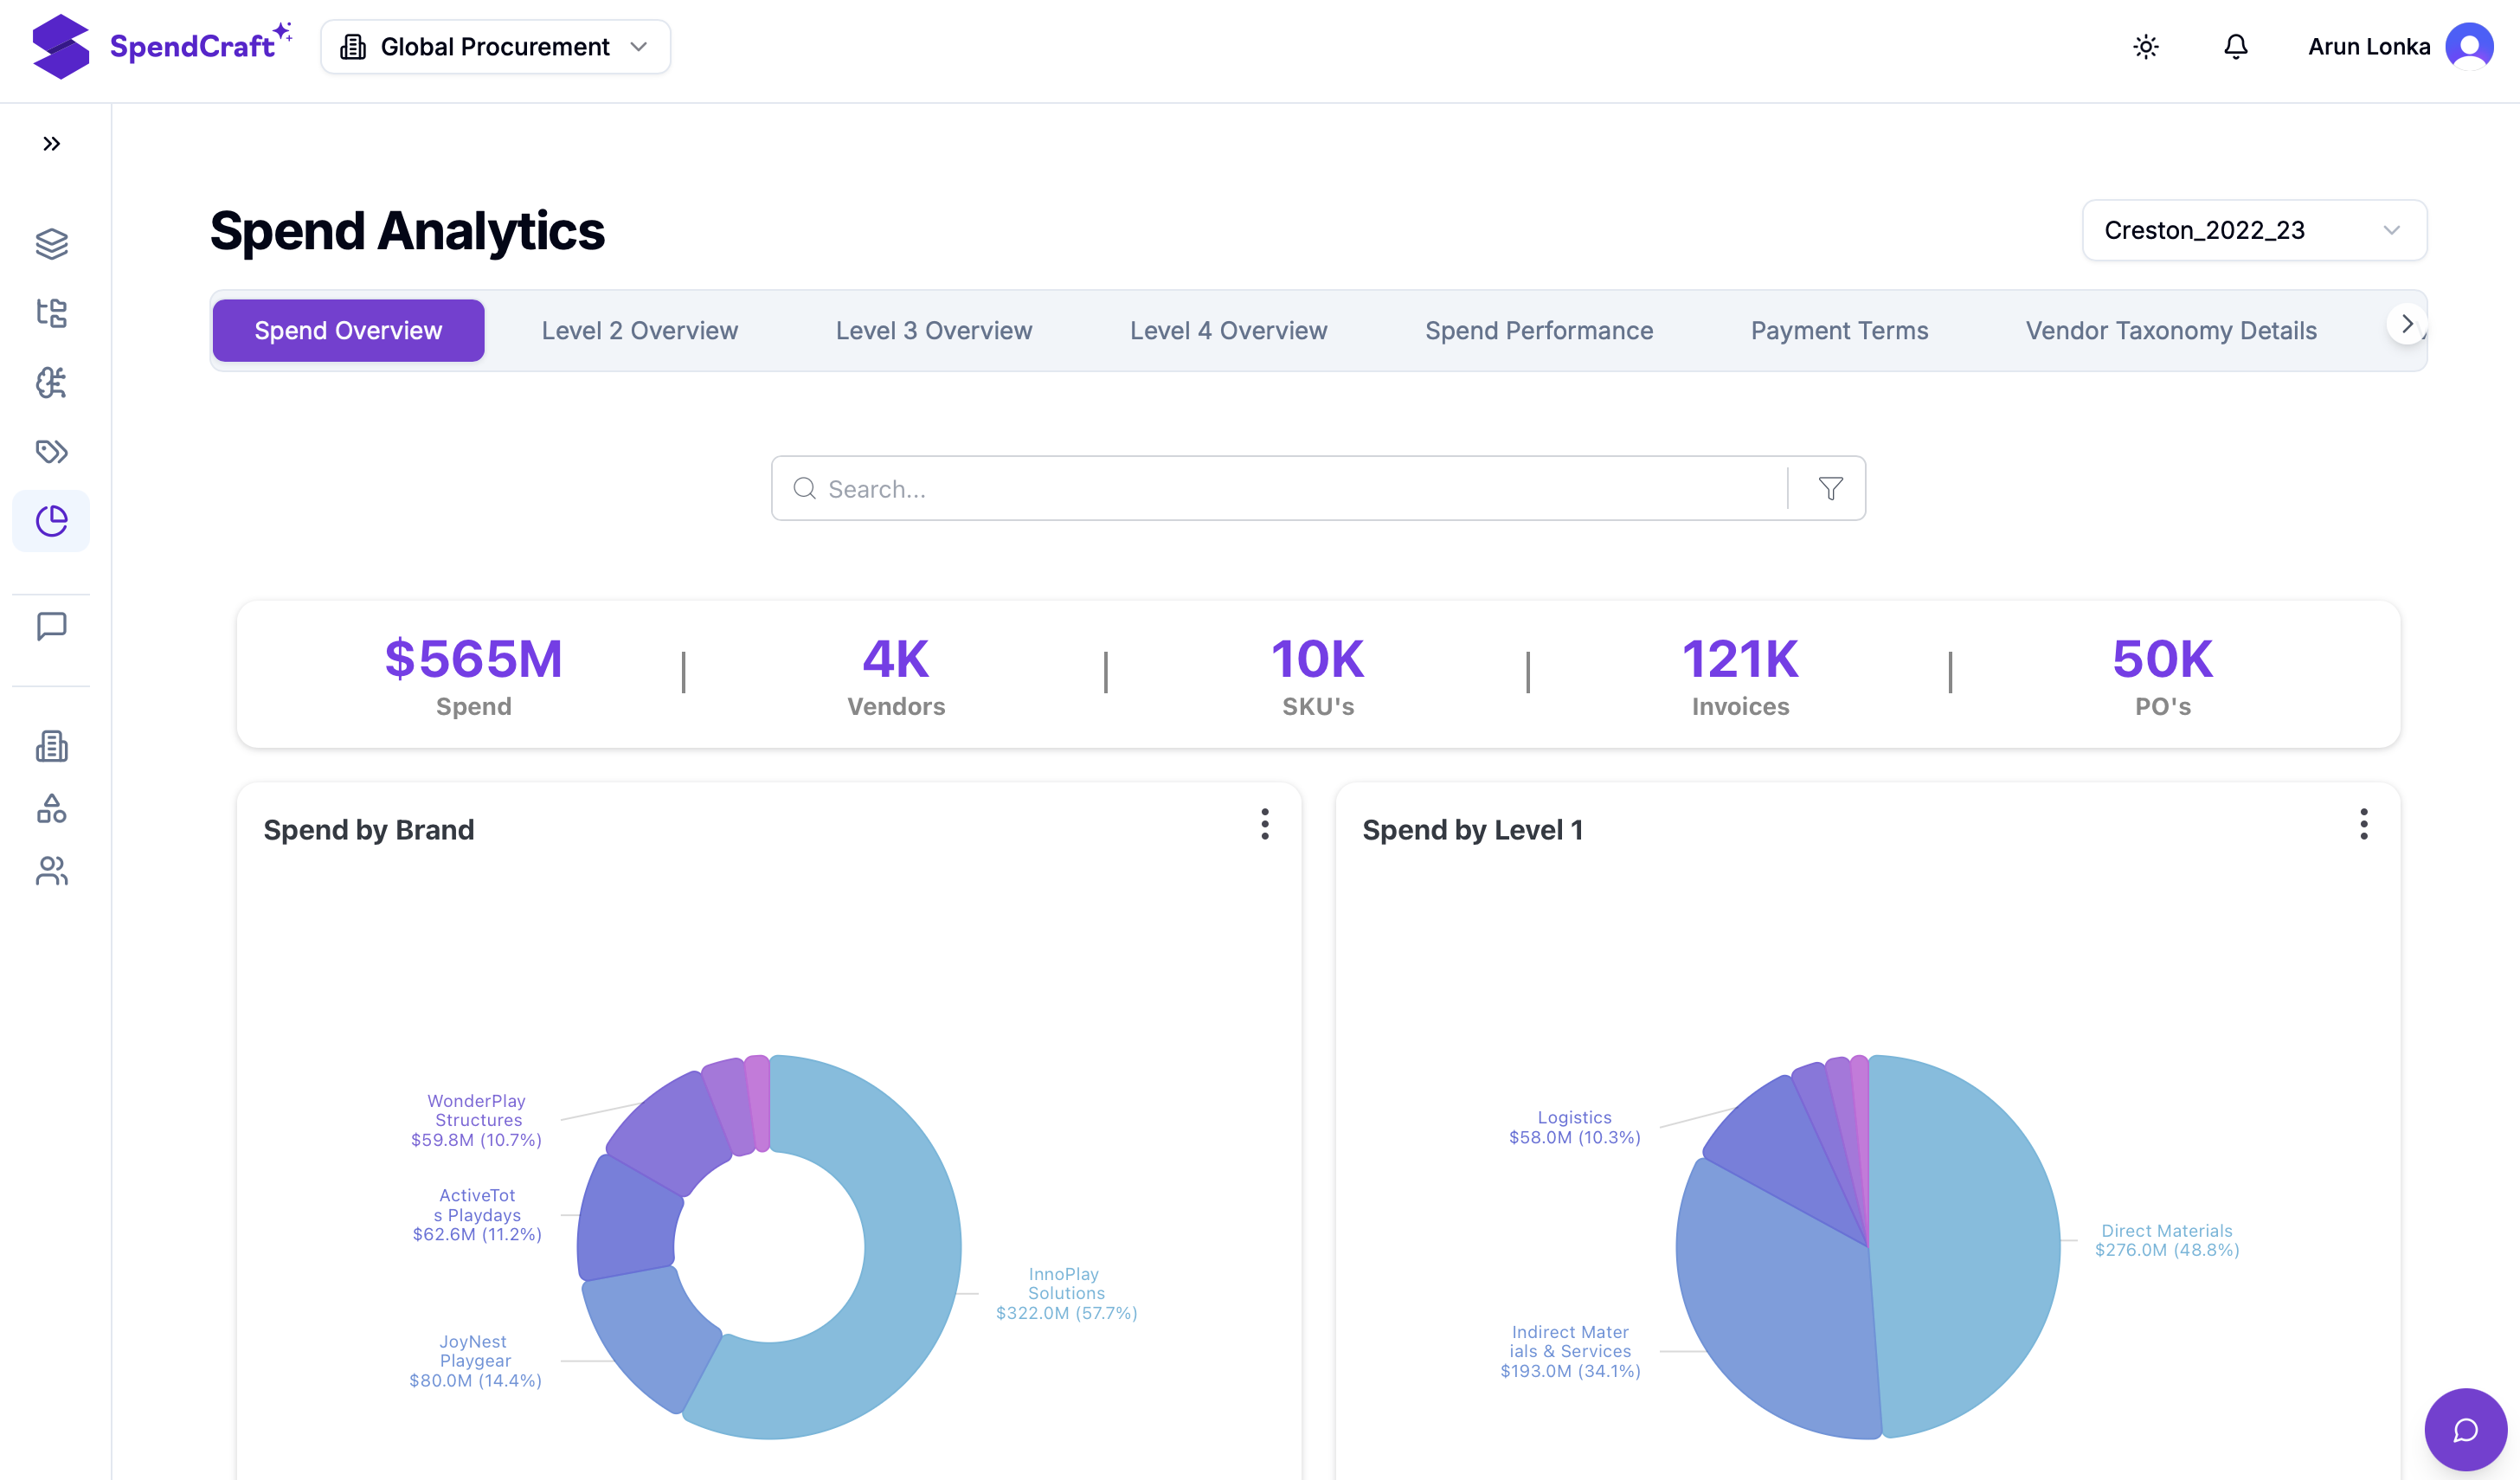
What Reporting & Analytics shows.
CATEGORY BREAKDOWN
See where your spend sits by category at any level of the taxonomy. Drill from top-level categories to sub-categories to the transactions behind them. No manual rollups.
VENDOR CONCENTRATION
Top suppliers, cumulative spend share, concentration ratios. See who your top 10 are, how much of your spend they hold, and where concentration is rising.
TREND ANALYSIS
Spend over time by category, supplier, entity, or dataset. Quarter-over-quarter, year-over-year, rolling twelve months, all running on the same classified foundation.
MULTI-DATASET COMPARISON
Compare across datasets: different periods, business units, or acquired entities. M&A integration, organic growth, and post-classification baselines, all in one view.
Every chart uses tabular figures. Every figure traces to the transactions that produced it. Drilldown is always available.
ONE DASHBOARD. EVERY FIGURE TRACED.
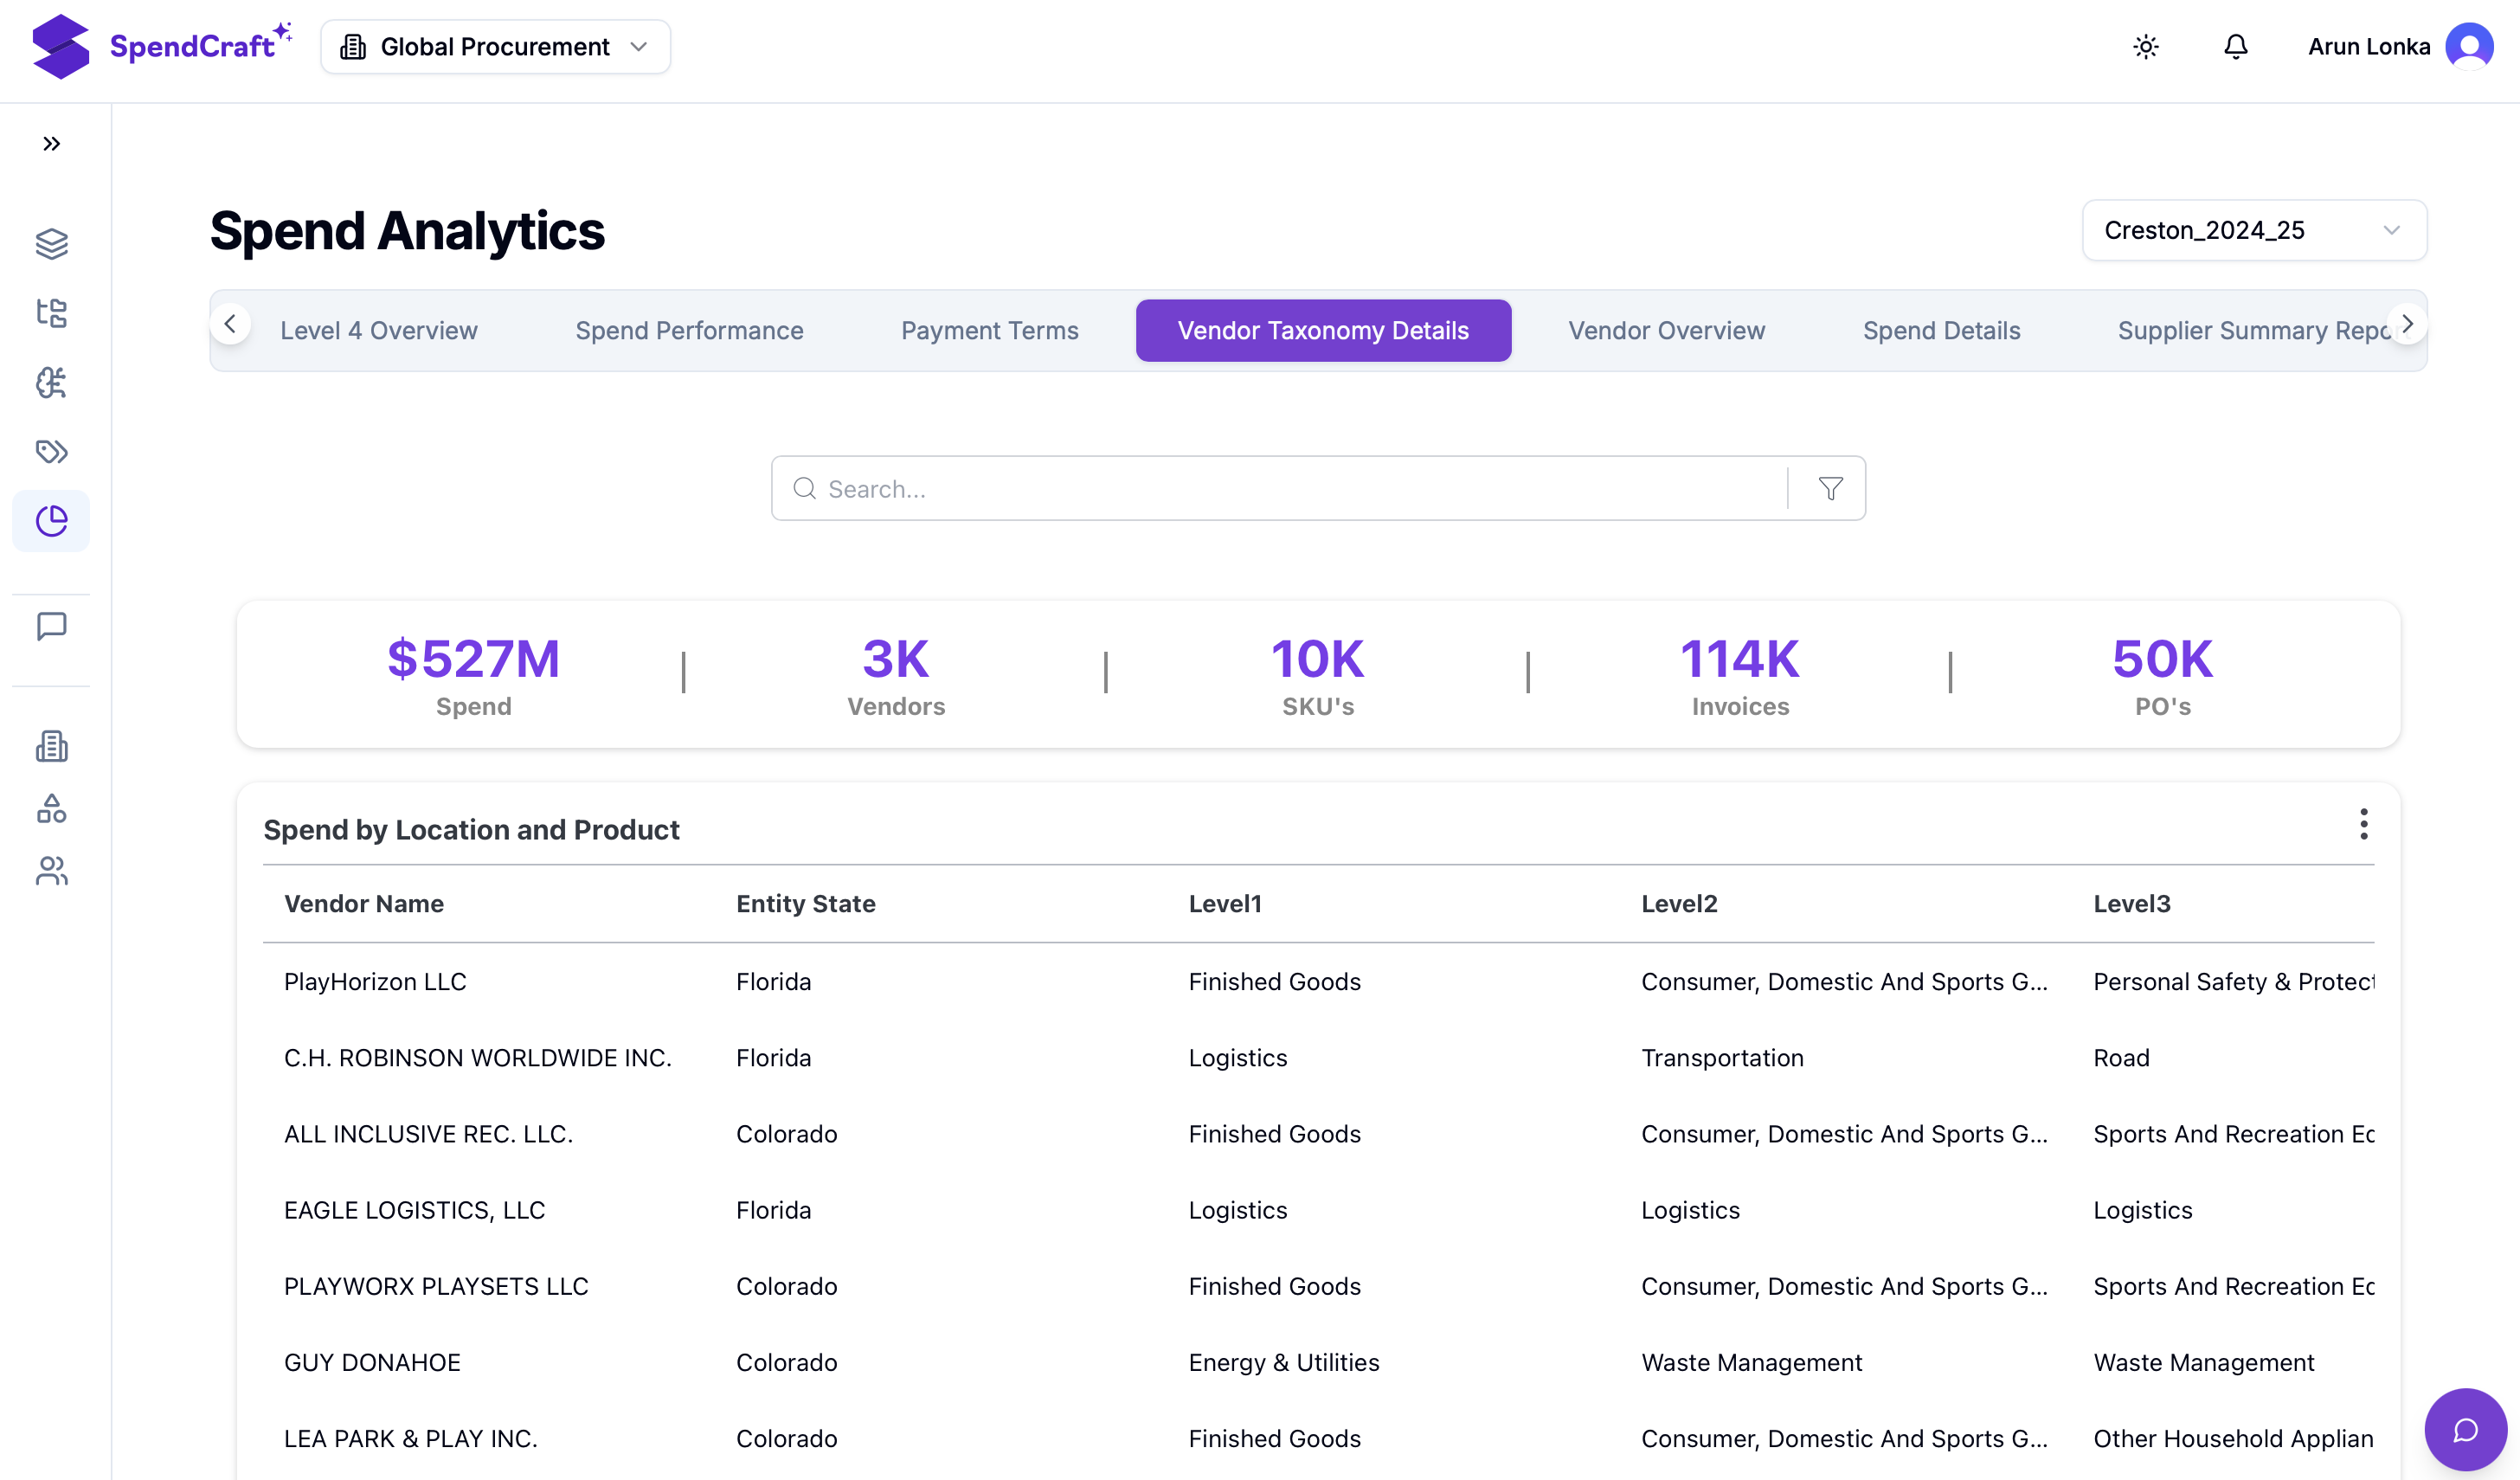
Every number on every dashboard ties back to classified transactions. Drill down when you need the detail. Export when you need to share.
Dashboards are only as good as the data underneath.
Every SpendCraft dashboard runs on classified, normalized spend: the same foundation that powers Savings Opportunity Scan, Tail Spend Scan, Supplier Radar, and Ask Crafter. One source of truth. One taxonomy. One set of numbers your whole team can cite. The dashboards work because the foundation does.
Pre-built
Not a template.
Grounded
In classified spend.
Ready
The moment classification completes.
GET STARTED
Pre-built analytics.
On your classified spend.
Classify once. Analyze always. No dashboard builder. No BI project. No waiting.
No implementation cost. Enterprise pricing available.
Enabling Business Users.